2. Additional data collection
You will collect more crop data - we aim to improve the performance of our model.
We will focus on broader classes, so don’t worry about identifying specific crop types. These broader classes are:
Broadleaf tree crops (Cashew, Mango, Longan, Rambutan, Durian, Orange)
Palm crops (Coconut, Oil Palm, Other Palm including Banana and Date Palm)
Shrub Crops (Pepper, Other Shrubs)
Annual Crops (Cassava, Maize, Bean, Rice, Sugarcane, Vegetables)
Other (Settlement, Water body, Rubber, Forest cover, Grassland, Shrubland, Other) - you will not collect data for this class.
We have three projects in CEO, one for Tbong Khmun, one for Kampong Cham, and one for Kampong Sveu. Each project has six 4 by 4 km plots that were further split into sixteen 1 by 1 km squares. This is to prevent losing data during the collection in CEO.
2.1. Getting Started
Login to Collect Earth Online.
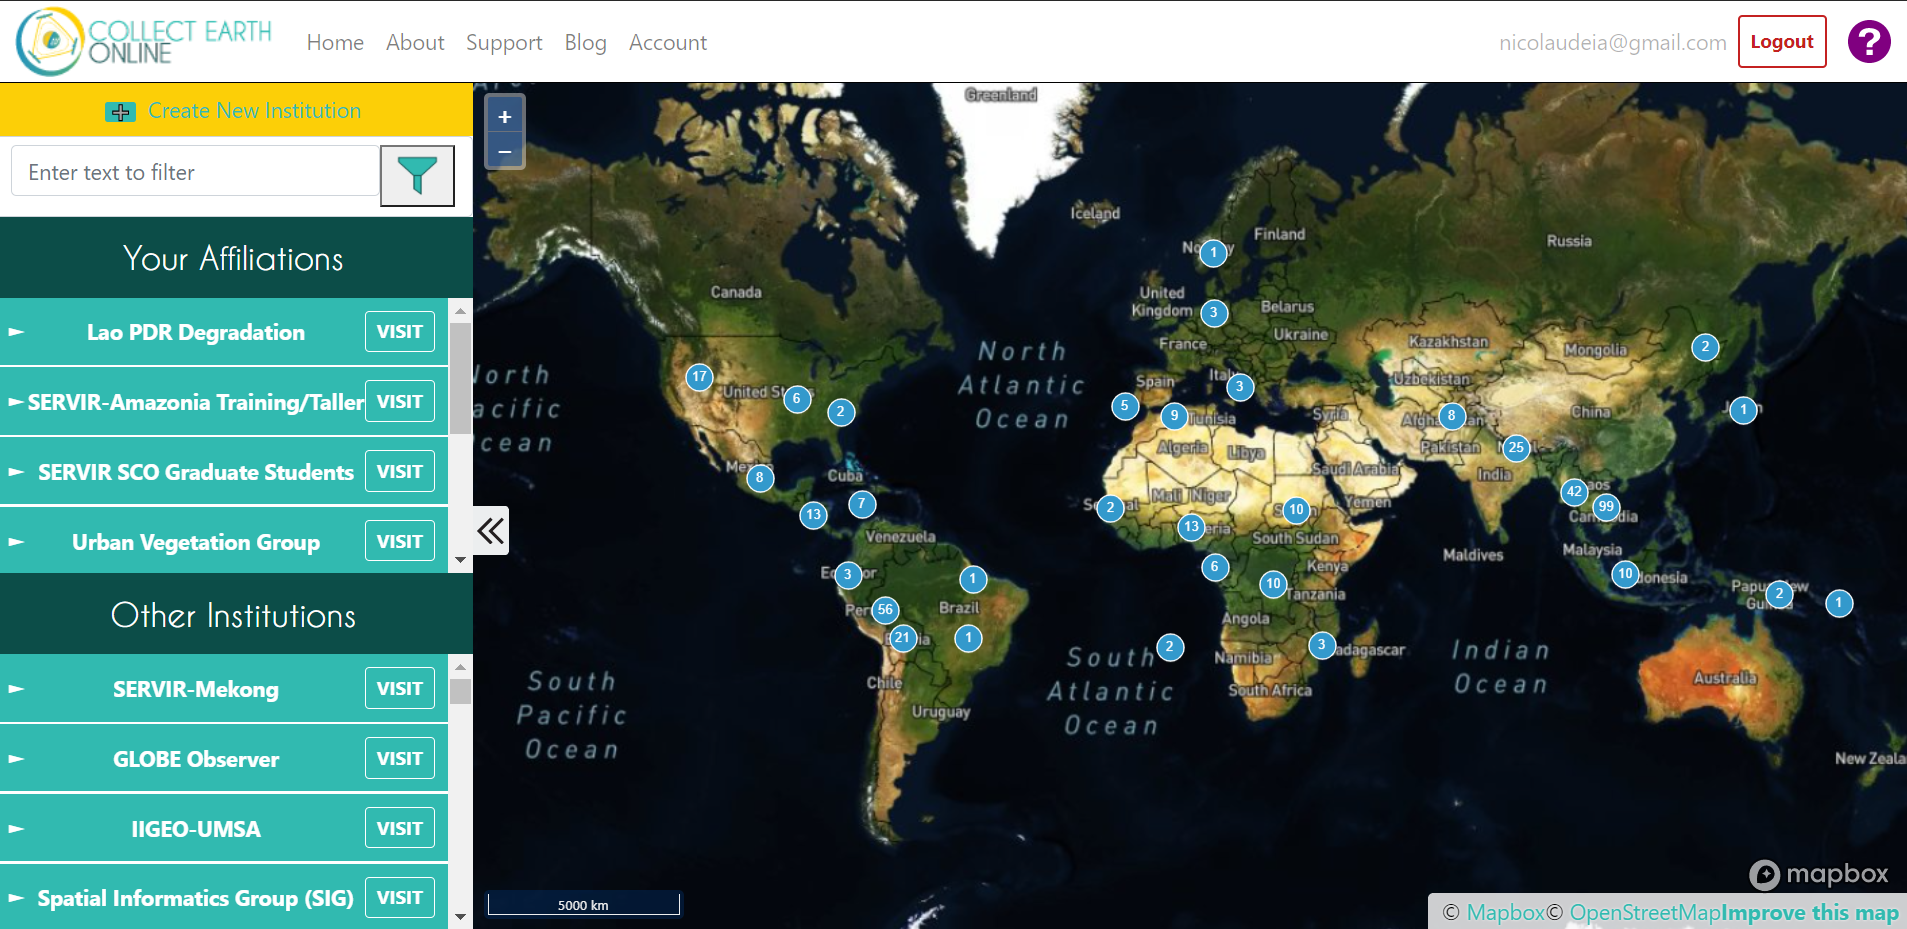
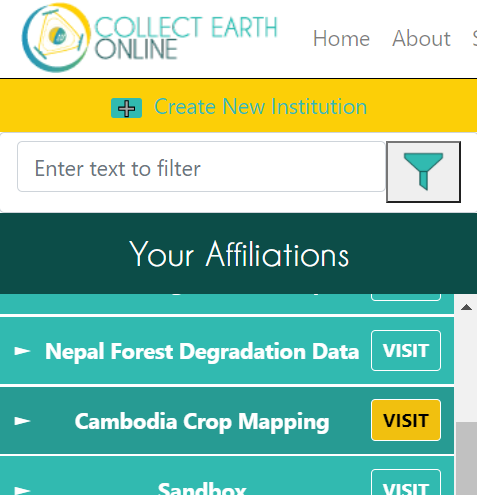
Go to the Cambodia Crop Mapping institution. You can look under “Your Affiliations” or search the institution using the search bar at the top. Click on Visit next to the institution.
On the institution page, click on your project. Either “Cambodia crops additional data collection - Kampong Cham” or “Cambodia crops additional data collection - Kampong Sveu”, or “Cambodia crops additional data collection - Tbong Khmun.
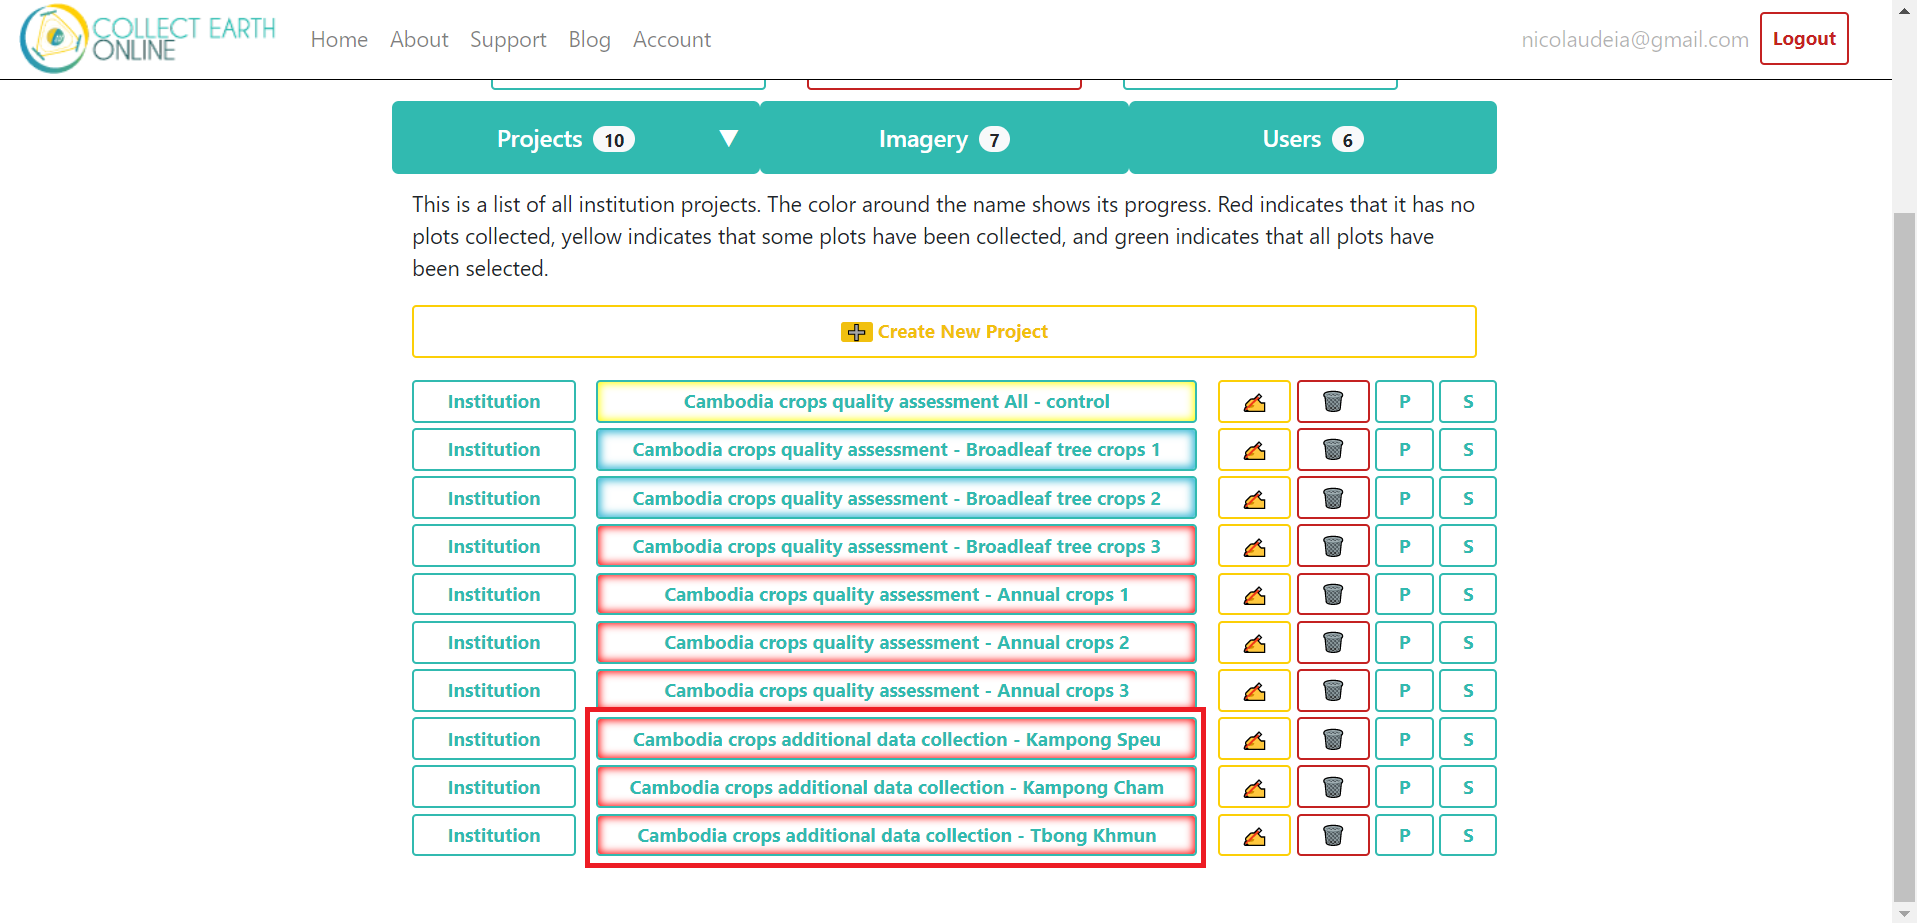
Go to the first plot to start the collection.

2.2. Instructions for each plot
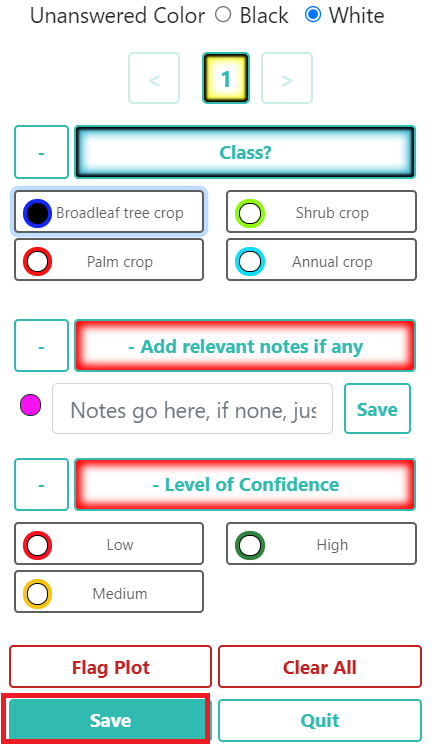
You will hand digitize polygons for the classes mentioned above. Every time you add a polygon using the proactive sampling tool, you will have to assign a class to it as shown below. You will also have the option to add any relevant notes regarding that polygon, and choose a confidence level.
Class |
Example |
Broadleaf tree crop |
Cashew, Mango, Longan, Rambutan, Durian, Orange |
Palm crop |
Coconut, Oil Palm, Other Palm including Banana and Date Palm |
Shrub crop |
Pepper, Other Shrubs |
Annual crop |
Cassava, Maize, Bean, Rice, Sugarcane, Vegetables |
You do not need to worry about the other Land covers (Settlement, Water body, Rubber, Forest cover, Grassland, Shrubland, Other), so do not collect polygons for these classes. We want to focus the time on the crops of interest only.
Follow these instructions:
Pick a corner or specific area to start. E.g.: top left corner, or a contiguous patch of same class.
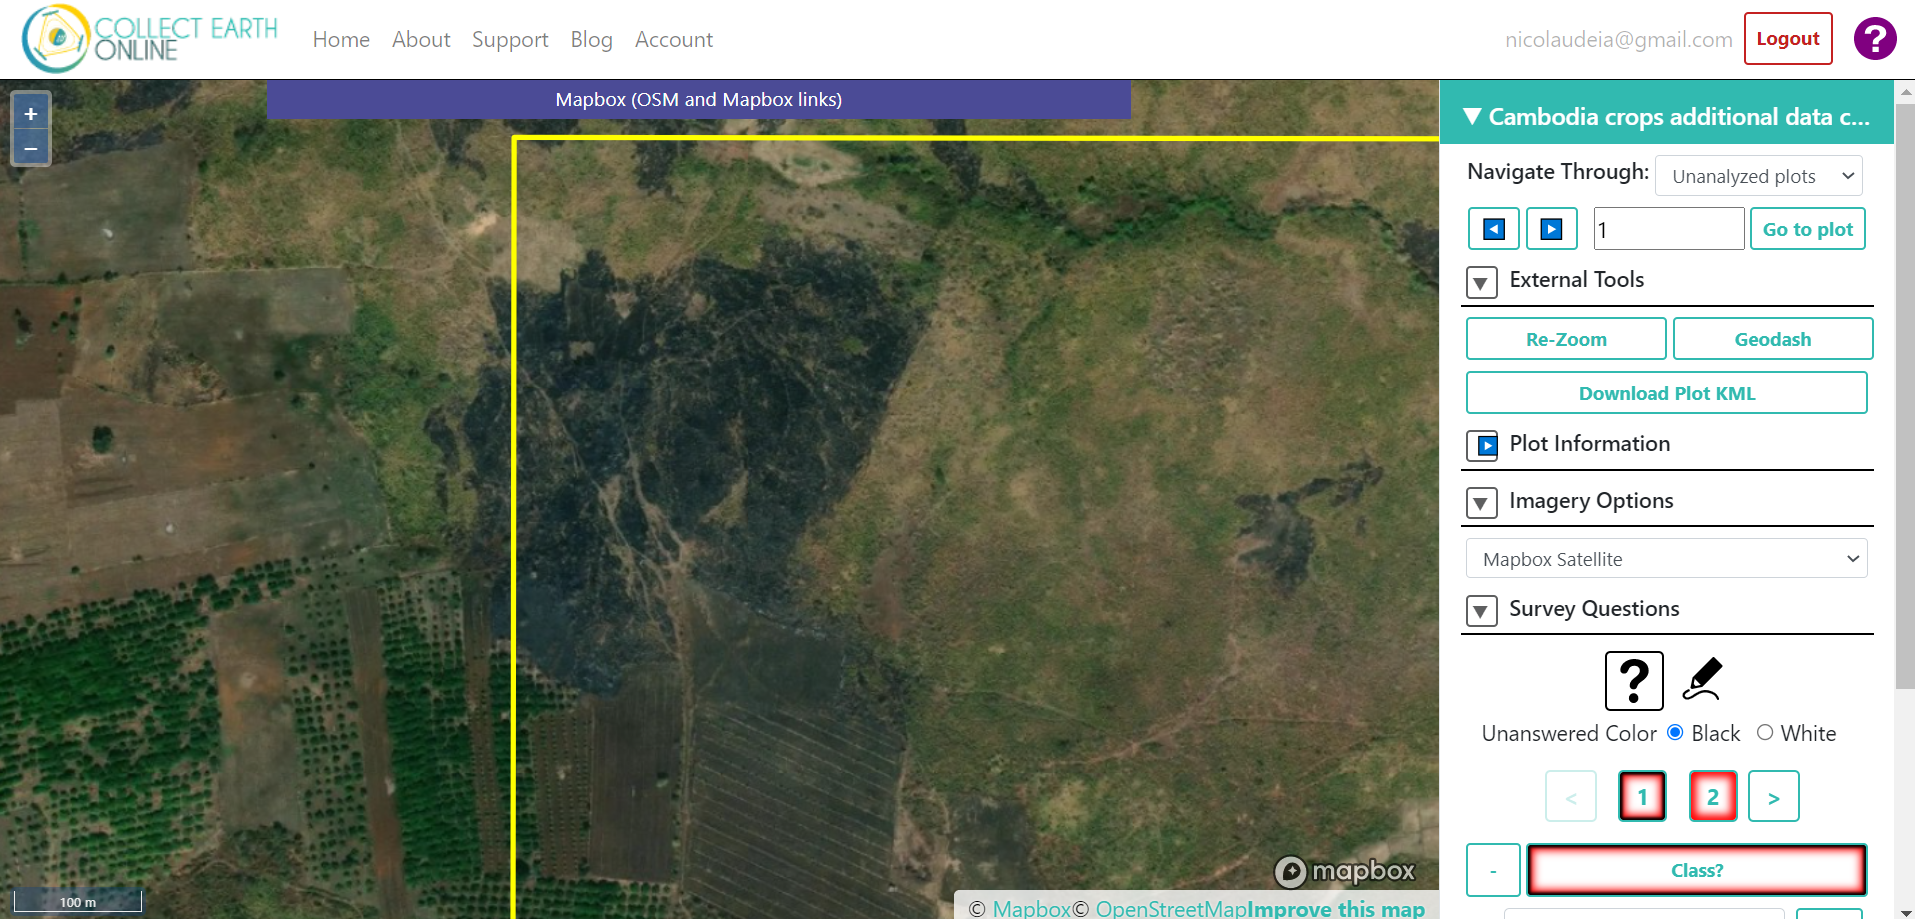
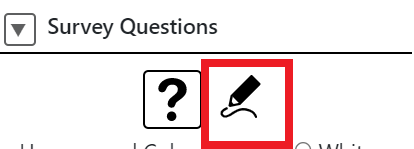
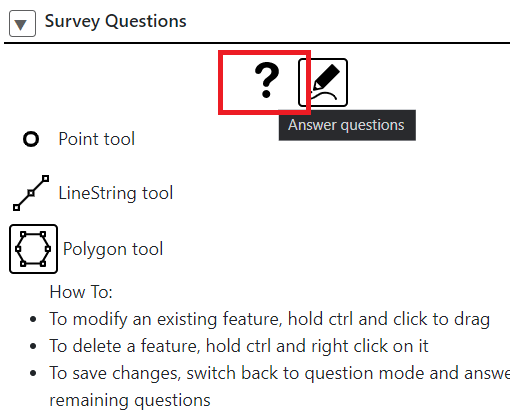
To start collecting the polygons, under “Survey Questions”, click on the pencil icon below “Survey Questions”.
The instructions to edit the sample will show up. Read the instructions to make sure you understand them.
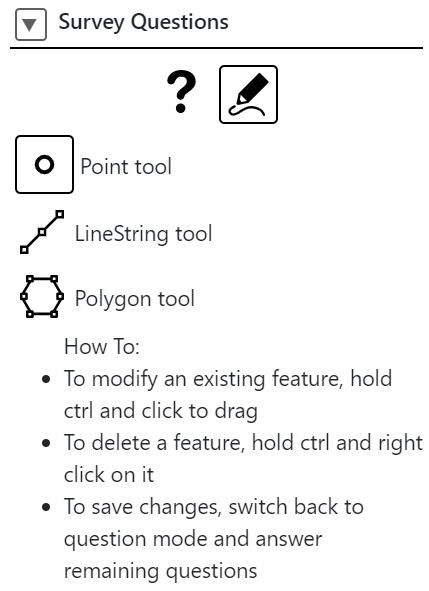
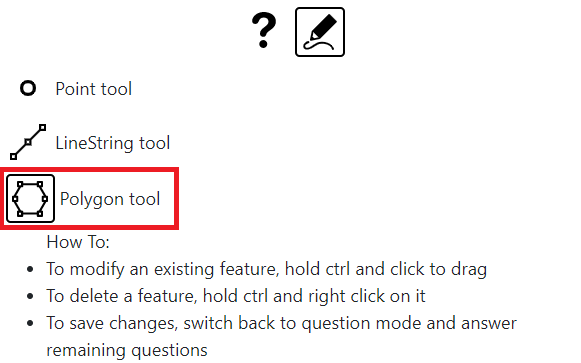
Add a new polygon to the respective area by selecting “Polygon tool” and using your mouse to draw it. Each click will place a vertice.
Note: To move around the screen (pan) in the editing mode, make sure you do it by holding the click, otherwise, any click will place a new vertice. Also use the scroll wheel of your mouse to zoom in and out the screen - this will help you in editing mode.
Note: If you need to fix a vertice after you finalized your polygon, you can hold ctrl and click a vertice to drag and fix it. Note that you can move vertices but you cannot add or remove vertices, for that, you will need to delete the entire polygon and start over.
Click on the question mark button (?) to go back to the survey question.
Click on the newly drawn polygon, and select the crop class.

Click again on the polygon before proceding to the other questions. Add any notes that might be relevant. If none, you can add a “0” and click Save next to it. Click on the polygon again and select your level of confidence (Low, Medium, or High)

Go back to editing mode to add more polygons and repeat the process.
Steps 6 and 7 are demonstrated below:
Note
- Make sure you use the basemap imagery available in your project:
Planet mosaics (Focus on 2019-12_2020_05 monthly mosaic)
UMD Tree canopy basemaps,
Bing Maps
Once you are done with all the polygons in this plot, Click Save to proceed to the next plot.
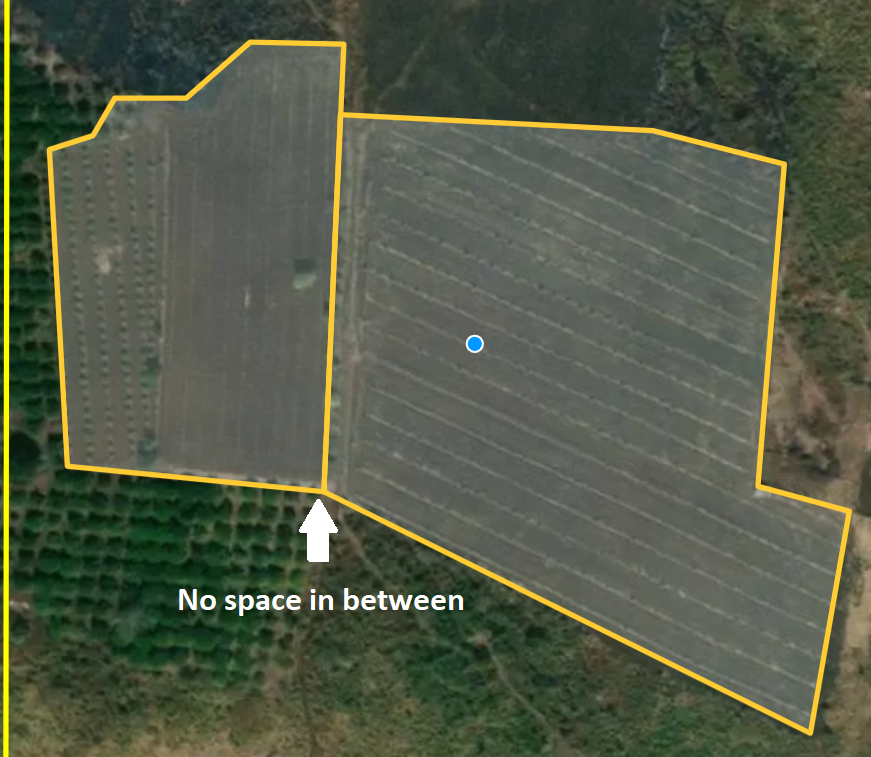
Make sure you cover all area of the plot, i.e., try to not leave any spaces between the polygons (only if there are no third class in between the polygons/classes). You can start a new polygon by clicking on the vertice of an existing polygon (your mouse should be automatically “be attracted” to a vertice).

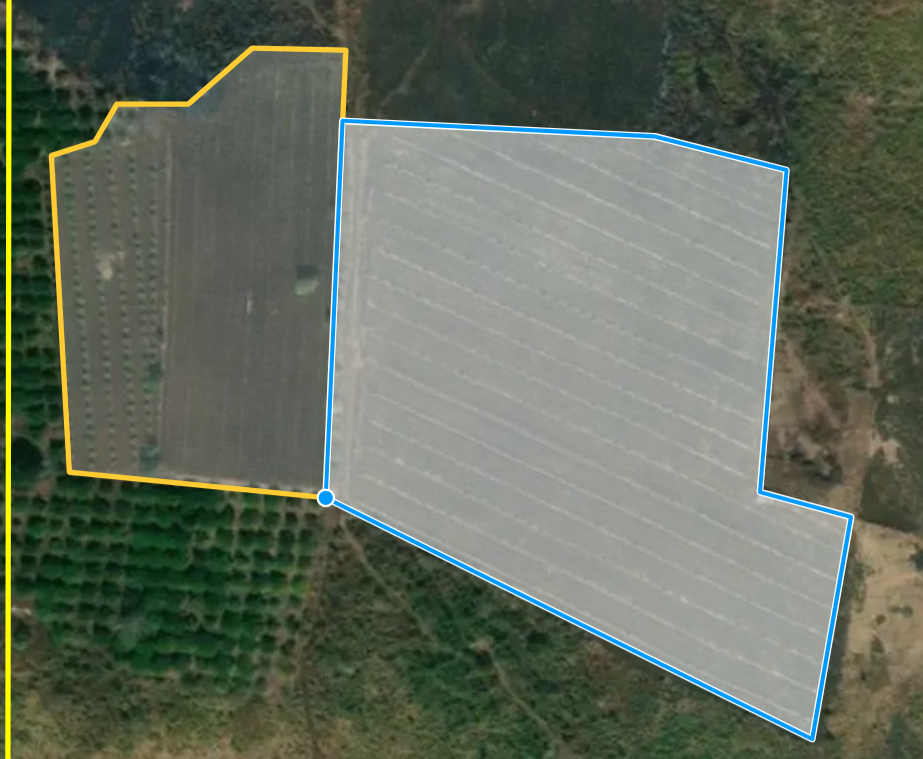
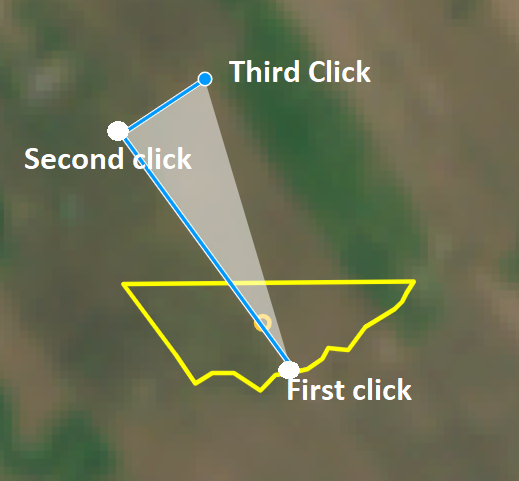
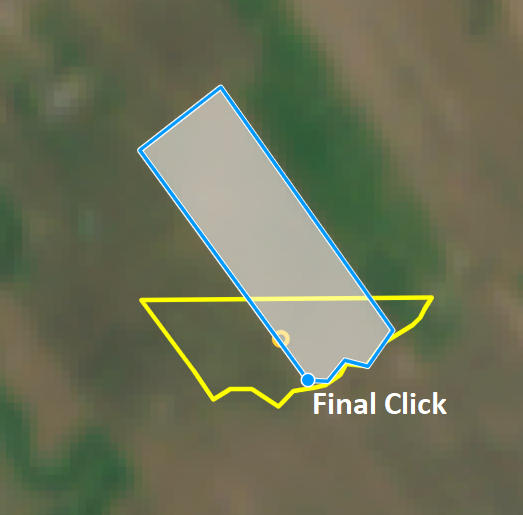
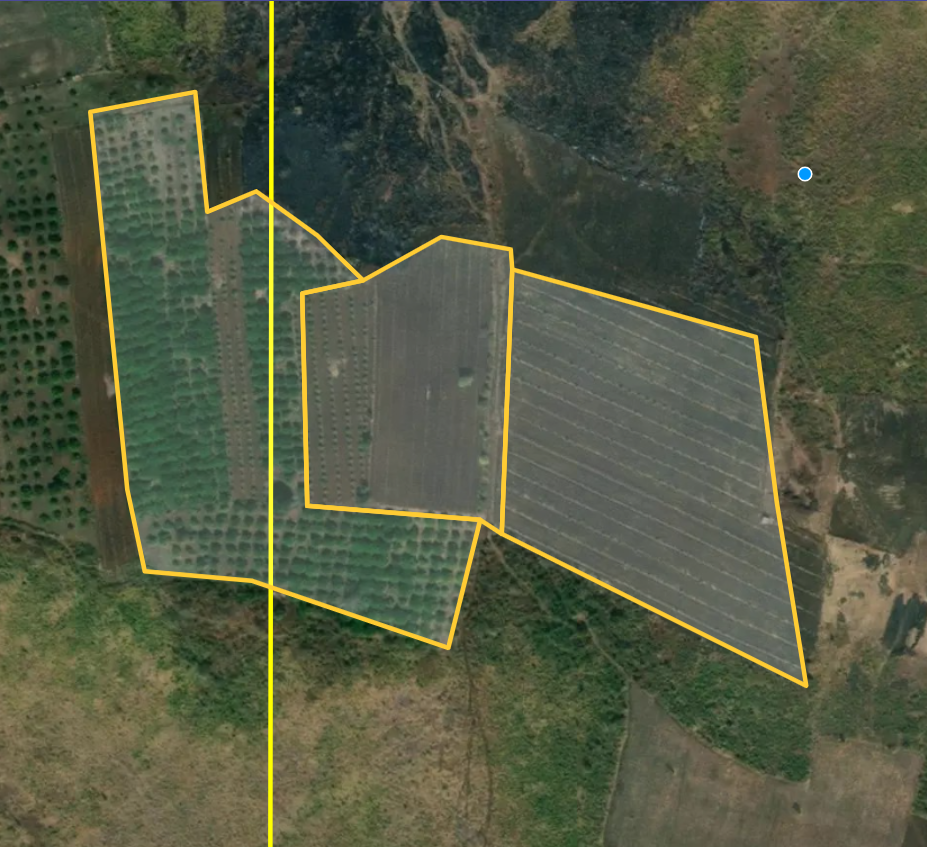
If you see that a crop field goes beyond the boundary of the plot, it’s okay to draw the polygon outwards as seen below:
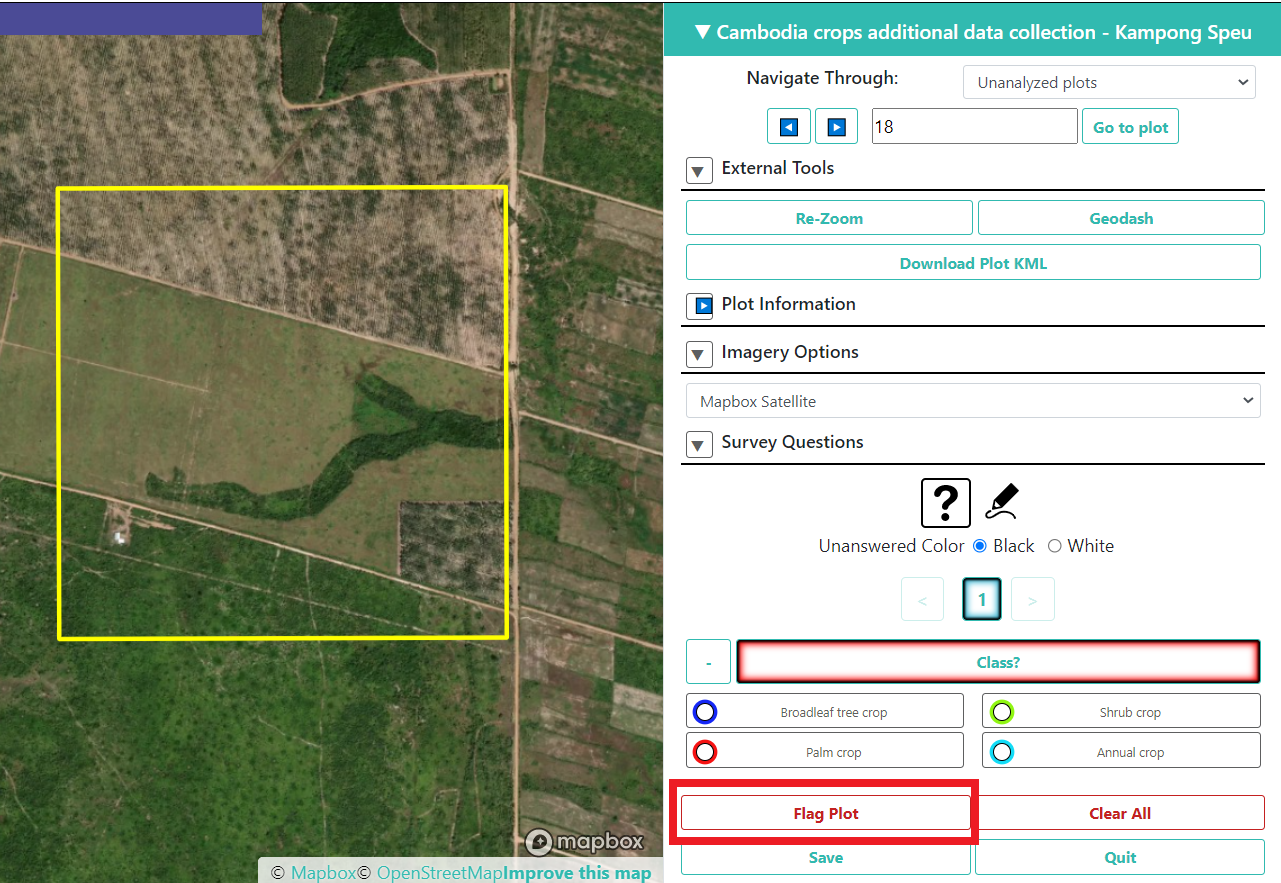
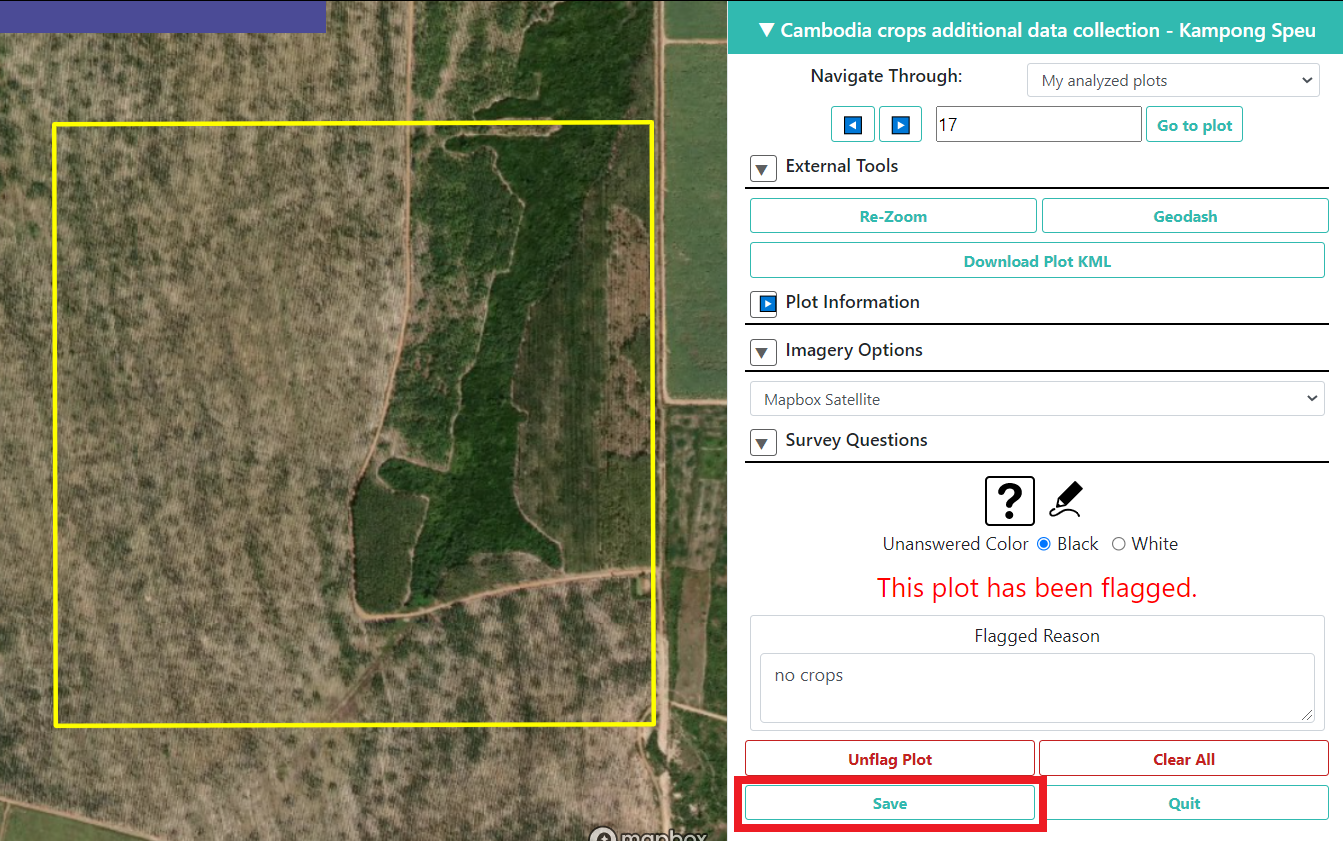
If you see an entire plot without any crops, only other land covers (Settlement, Water body, Rubber, Forest cover, Grassland, Shrubland, Other), you can flag the plot and save to proceed to the next one.
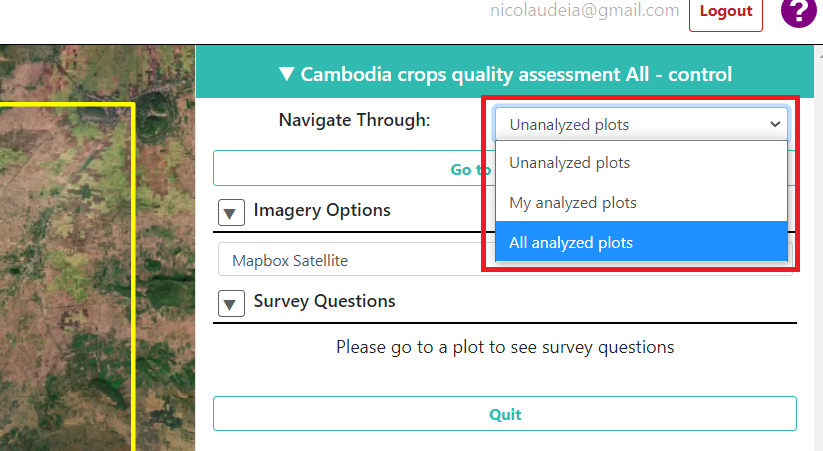
Note: If you wish to change or review previously analyzed plots, at the top of your project you can change the “Navigate Through” from “Unanalyzed plots” to “All analyzed plots”. With this option, by clicking the arrows you will go through the plots you have already analyzed. You can change your answers but make sure you click Save at the bottom to save any changes.
2.3. Contact
We know the process might not be entirely straightforward, so if you have any questions we will be happy to help! We have done this ourselves and understand the doubts that might arise. Please contact apnicolau@sig-gis.com, kdyson@sig-gis.com, and ktenneson@sig-gis.com for support.